Factors to Consider When Valuing a SaaS Company
 By Paul Wilson
It comes as no surprise that technology companies offer some incredibly attractive investment opportunities with massive scalability at a lower cost, meaning when done right an investment can generate some striking investment growth. What may be less readily known however, is technology businesses and in particular software as a service (SaaS) businesses require a more complex valuation process than that of traditional businesses.
For those less familiar with SaaS businesses, it’s worthwhile reading James Johnstone’s piece on the scalability of Australian SaaS businesses. James is an Investment Director at Bailador and has worked closely with some of the SaaS businesses across our portfolio.
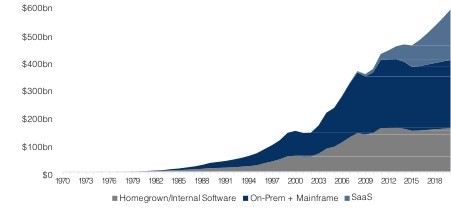
The graph below provides a clear example of the growth of SaaS companies in comparison to that of traditional software businesses over the last 20 years.

Source: Neeraj Agrawal & Logan Bartlett, Battery Ventures, Software 2017)
SaaS businesses typically employ a subscription revenue model, meaning that the revenue repeats year after year, unless a customer decides to switch off. This model provides a highly predictable revenue stream. Together with the ability to achieve high gross margins, low capital required to scale, and huge global addressable markets, these factors drive valuations for SaaS businesses which at first can look quite high in comparison to a more traditional business.
We will take a look below at some of the factors to look for in identifying a quality SaaS business, and some elements contributing to its valuation.
High gross margin
Good SaaS businesses achieve quite high gross margins - 75% plus is a benchmark. This is because they do not incur many of the traditional elements of manufacturing, transport, and physical infrastructure costs. For an established software platform, there is little difference in cost to serve 5,000 customers as 50,000 customers
Pro tip - examine whether all of the relevant costs of delivering the service have been included to get to the stated gross margin. It is important to compare ‘apples to apples’ across companies.
Low churn rate
Customer churn, or attrition, is an important factor to consider when analysing software businesses. It is a pretty good indicator of how satisfied customers are with the experience they are getting, so speaks to the quality of the service. The lower the churn rate the better.
In many SaaS businesses, customers sign on to an open ended relationship. Ie – unless a customer actively switches off the service, then revenue continues to be generated. Also, the cost of retaining a customer is generally far less than the cost of acquiring a new one.
This measurement is particularly important for business-to-business and financial products, as the sales process can be more difficult when considering necessary approvals and trust barriers that need to be overcome.
Thanks to big data analytics, customer interaction and personalisation, effective companies are often able to achieve low churn rates. You may sometimes hear this referred to as ‘sticky’ customers and revenue.
Customer payback period
As suggested by the name, customer payback period is the amount of time it takes for profit generated from a customer to pay back the cost associated with the acquisition of that customer – essentially a breakeven point.
Many Silicon Valley investors will indicate that a payback period of less than two years represents a quality company. At Bailador we prefer payback periods to be closer to a year.
For SaaS businesses in particular, the customer payback period is of significant importance, as it offers an insight into businesses’ scalability. A shorter payback period offers two major advantages: a smaller capital requirement to scale and the capability to develop at an increased pace.
Customer Lifetime Value
For a subscription business, if you have accurate data, you can understand whether each additional customer added to the platform is adding value and how much. Extending the concept of Customer payback period, you can examine the ongoing contribution from customers, and how long customers stay on the platform on average, to give a Customer Lifetime Value. This should be a multiple of the cost to acquire a customer.
The higher the Customer Lifetime Value is as a multiple of the cost to acquire a customer, the more confidence a business has to continue to invest to drive growth.
Revenue Growth Rate
Of all key metrics, Revenue growth rate tends to have the highest correlation with valuation of SaaS companies. Other metrics are important to determine the health of a business, as we have examined above. However, if you can have solid metrics in each of those areas, then revenue growth is a key indicator of the success a business is enjoying in executing its plans.
Valuation - Why Revenue multiple?
Revenue multiple tends to be the primary metric referenced when valuing a SaaS business. If a SaaS business has strong gross margins, low churn, and attractive pay back period and lifetime value, then businesses will seek to invest to grow as fast as possible. As long as it is known that each customer you bring on board is adding substantial overall value, then a business may be prepared to invest in a period of ‘cash burn’ in order to take maximum advantage of their position, and drive fast growth.
Premium returns are often available for the leading player in a particular space. Once a business establishes a leading position, many new customers will choose that leader by default. Other relevant platforms in an ecosystem will almost always choose to prioritise partnerships and integration with other leaders, making it harder for others to play catch up. Businesses can justifiably be willing to invest heavily to claim that position.
For SaaS businesses at the expansion stage, this can mean that current profitability is not the top priority, or the most effective valuation measure in the short term.
If a business does make a decision to move away from short term profit to drive long term value, it is critical to understand that the key metrics are in a healthy position. If that is the case then revenue size and growth become the key factors many investors use to determine valuation, by applying a multiple to that revenue.
Calculated by dividing enterprise value (market cap + debt – cash) by revenue, the revenue multiple provides a leading tool for comparison of the relative valuation of SaaS businesses.
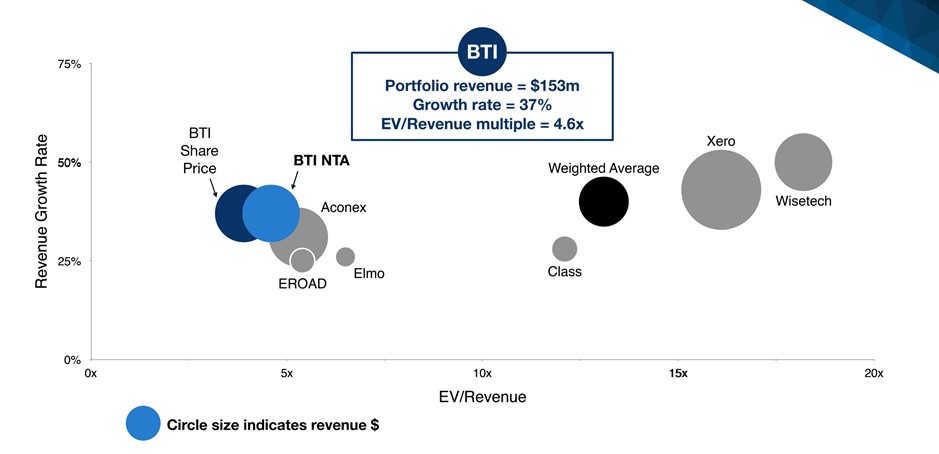
SaaS businesses make up the bulk of the BTI portfolio. The graph below shows Bailador’s portfolio’s revenue, growth and revenue multiple in comparison to other ASX listed technology businesses.

(Source: Bailador Annual General Meeting 2017)
The Bailador portfolio taken together had revenue of over $150m which grew at 37% during FY17. These metrics compare quite well with ASX tech leaders such as Xero and Wisetech, yet the implied revenue multiple for the BTI portfolio NTA offers over 50% upside in comparison. Even further upside is available when you consider that the BTI shares are currently available at a price lower than the published NTA.
As a specialist technology investor, with a track record of successfully investing in and developing SaaS businesses, Bailador is in a fortunate position to compare hundreds of opportunities, their metrics and how they are calculated. We believe that this gives us an advantage in identifying and backing the leading SaaS businesses as they emerge in their fast growth phase.
