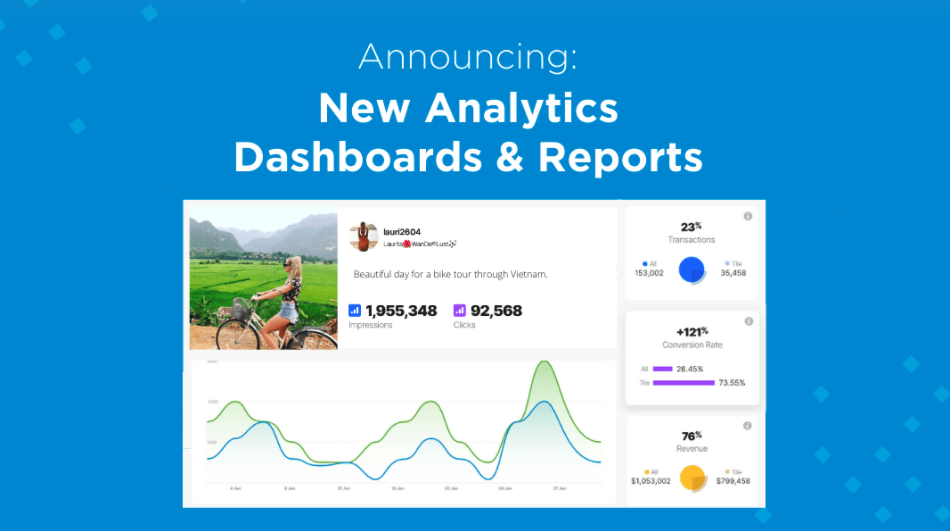
Stackla announces new analytics dashboards & reports
Since data insights are the blueprint for any successful marketing strategy, we want to make it easier for you to measure what matters and quickly draw meaningful insights into how your user-generated content (UGC) is performing — not just on its own, but also within the context of your overall marketing strategy.
To do so, we’ve completely redesigned the analytics dashboards and reports within our platform, bringing together existing Stackla insights with your brand’s Google Analytics and Tracking Pixel data to form a new, centralized destination for you to:
Understand how UGC performs within your broader content strategy – Whether you want to dig into a single slice or see the whole pie, our new dashboards provide a greater breadth and depth of insight into how your UGC is performing — on a Tile, Widget and Product Tag level — in relation to the other content on your site.
See the ROI of social commerce – If your brand’s website also serves as an online storefront, Stackla-powered UGC can help to shorten the path to purchase and drive online conversions. Now, our new commerce dashboards make it easy to track the impact shoppable UGC is having on your visitor’s shopping behavior.
Glean actionable email and Organic Influencer insights – Gain a deeper understanding of how audiences are engaging with UGC throughout your email activations and Organic Influencer communities to help optimize your ongoing and upcoming campaigns.
Track content performance over time – Explore performance trends by setting custom date ranges to filter reporting views and compare results over time. Need to share results from specific time periods? PDF exports are now available on all new dashboards.
Click here for the full details on the changes.